Learn Before
WAV Files
Alternate Line Plot Method
Visualization of waveforms
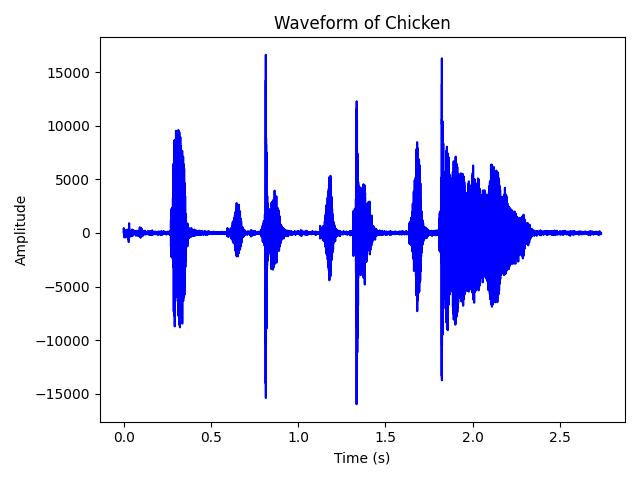
We can use Matplotlib, NumPy, and the wave module to plot waveforms of WAV files.
import matplotlib.pyplot as plt
import numpy as np
import wave
import sys

wav=wave.open('chicken.wav', 'r')
#We only want to use mono files
if wav.getnchannels()==2:
  print('Stereo files are unsupported. Use mono files.')
  sys.exit(0) #Terminates program

raw=wav.readframes(-1) #This reads all frames, returns them in byte form
raw=np.frombuffer(raw, dtype='int16') #Converts bytes to integers
sample_rate=wav.getframerate()
time_=np.linspace(0, len(raw)/sample_rate, num=len(raw))

plt.title("Waveform of Chicken")
plt.plot(time_, raw, color="blue") #Plot time and amplitude
plt.xlabel("Time (s)")
plt.ylabel("Amplitude")
plt.tight_layout()
plt.savefig('chicken.png')
plt.show()
This should result in something like this:

0
1
4 years ago
Tags
Python Programming Language
Data Science
Related
Basics of Audio Editing using SciPy File I/O
Audio Creation
Visualization of waveforms
Pandas Dataframe vs. plt.plot
Visualization of waveforms