Learn Before
A researcher measures 'reaction time' in two different groups on a cognitive task. Both groups have an identical mean of 300 milliseconds. In Group A, the scores are tightly clustered (ranging from 290ms to 310ms). In Group B, the scores are spread across a much broader range (ranging from 100ms to 500ms). Referring to the provided image of two distributions, match each research observation to its corresponding statistical characteristic.
0
1
Tags
KPU
Research Methods in Psychology - 4th American Edition @ KPU
Related
Which of the following best characterizes a distribution with high variability?
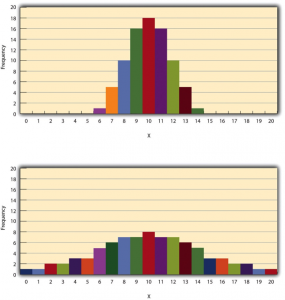
Based on the provided image, the distribution represented by the taller, narrower curve has a lower level of variability than the distribution represented by the shorter, wider curve, even though they share the same mean.
A researcher measures 'reaction time' in two different groups on a cognitive task. Both groups have an identical mean of 300 milliseconds. In Group A, the scores are tightly clustered (ranging from 290ms to 310ms). In Group B, the scores are spread across a much broader range (ranging from 100ms to 500ms). Referring to the provided image of two distributions, match each research observation to its corresponding statistical characteristic.
A researcher is measuring 'Stress Levels' (on a scale of 1-10) across three different treatment groups, all of which resulted in an identical mean score of 5. Analyze the visual data in the provided image along with the scenario descriptions to arrange the groups in order from the lowest variability (position 1) to the highest variability (position 3).
You are designing a high-precision experimental study on human reaction times. Your goal is to create a research protocol that minimizes extraneous variables so that your results resemble the taller, narrower curve in the provided image. Which of the following design strategies should you implement to achieve this low-variability outcome?
Two distributions share the same mean of 10, but the first has scores clustered tightly around the center while the second has scores spread across a much broader range. A researcher concludes that the mean is a less representative summary of the 'typical' participant in the second distribution because its scores possess _____ variability.
Match each variability concept with the description that best represents it.
A researcher collects final exam scores from two different sections of an introductory psychology course. Both sections have a mean of 78, a median of 78, and a mode of 78. The researcher concludes that because all three measures of central tendency are identical, the two score distributions must look identical when graphed. Based on what you know about central tendency and variability, this conclusion is correct.
A clinical researcher compares two therapy groups on a standardized well-being scale. Group A and Group B both show a mean score of 60, yet when the researcher graphs the two distributions, Group A's curve is tall and narrow while Group B's curve is short and flat. This difference in shape reveals that Group A has _____ variability than Group B, meaning its individual scores deviate less from the mean.
A researcher wants to evaluate which of two newly developed psychological assessment tools produces more consistent scores. Both tools yield the same mean, median, and mode of 50 across a sample of 100 participants, so central tendency cannot differentiate them. Arrange the following steps in the order that best reflects a sound, justified evaluation of the two tools' variability.
Define the concepts of low and high variability as they relate to frequency distributions. In your explanation, describe how two distributions can compare in terms of their central tendency (mean, median, and mode) versus their variability.
Based on this scenario, diagnose the relationship between central tendency and variability for the two groups. Contrast the distributions of Group A and Group B using the concepts of low and high variability.
Suppose you are comparing the final exam scores of two psychology classes. Both classes have an identical mean, median, and mode of 75. Class 1 has low variability, while Class 2 has high variability. Apply the concepts of low and high variability to describe what the spread of student scores looks like in each class.