
Learn Before
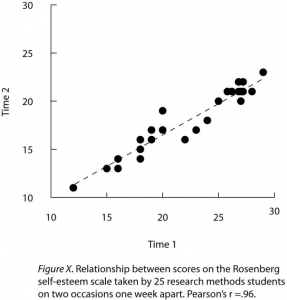
Analyze the visual structure of the provided scatterplot showing the relationship between 'Stress' and 'Symptoms'. Arrange the following steps in the correct logical order to explain how this visualization was constructed to represent the quantitative relationship between the variables.
0
1
Tags
KPU
Research Methods in Psychology - 4th American Edition @ KPU
Related
Which of the following best describes how data is visually represented in a scatterplot?
Examine the provided scatterplot graph. Based on the defining characteristics of this visualization in psychology research, match each graph component with its correct statistical description.
A researcher is investigating whether a student's 'Academic Major' (such as Psychology, Biology, or Art) influences their 'Grade Point Average' (GPA). To visualize the results, the researcher chooses to use the type of graph shown in the provided image. Is this an appropriate application of this visualization?
Analyze the visual structure of the provided scatterplot showing the relationship between 'Stress' and 'Symptoms'. Arrange the following steps in the correct logical order to explain how this visualization was constructed to represent the quantitative relationship between the variables.
Equal Axis Length in Scatterplots
Representing Overlapping Points in Scatterplots
Regression Line
A scatterplot is particularly useful for visualizing relationships when the independent variable on the -axis possesses a wide range of levels.
A psychology researcher is investigating the relationship between 'Stress' and 'Physical Symptoms.' Both variables are quantitative and have many possible numerical values. Based on the concept of a scatterplot, why is the visualization shown in the image appropriate for this study?
A reviewer evaluates a manuscript in which the authors used a bar graph to display the relationship between participants' age (a quantitative variable spanning a wide range of values) and their memory scores. The reviewer correctly argues that a(n) _____ should have been used instead, because it plots each individual's scores as a single point at the intersection of the two axes and preserves the full distribution of values rather than collapsing them into group means.
A health psychologist collects data from a sample of college students to examine the relationship between daily caffeine intake (in milligrams, ranging from 0 to 800 mg) and resting heart rate (in beats per minute, ranging from 60 to 110 bpm). They decide to construct a scatterplot of their data. Match each component of the study's data to its correct visual representation on this scatterplot.
A psychology researcher has collected survey data on 'screen time' and 'academic focus' from 100 participants. To systematically analyze the resulting scatterplot, arrange the following steps in the correct logical order, from the initial inspection of scales to the final detection of anomalies.
A student researcher is evaluating the draft figure shown in the image, which displays the correlation between daily 'Stress' on the -axis and 'Physical Symptoms' on the -axis for a sample of participants. A peer suggests connecting the data points with a continuous line from left to right to make the trend visually clearer. The student correctly evaluates this suggestion as methodologically inappropriate because there is no sequential, temporal, or continuous transition from one parti