Learn Before
Example of an APA-Style Line Graph
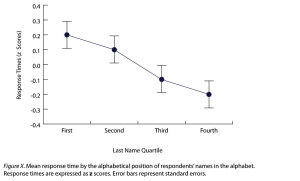
An APA-style line graph is particularly useful for presenting experimental results when the independent variable is quantitative or measured continuously. For instance, in the research by Carlson and Conard, a line graph displays the mean scores on a dependent variable for participants at distinct levels of an independent variable. Similar to bar graphs, each data point on the line often includes vertical error bars representing the standard error to visualize variability and statistical significance.
0
1
Tags
KPU
Research Methods in Psychology - 4th American Edition @ KPU
Related
Comparing Bar and Line Graphs
Line Graphs in Correlational Research
Line Graphs in Factorial Designs
Example of an APA-Style Line Graph
In an APA style line graph, what does each plotted point typically represent?
Match each component of an APA-style line graph with the specific type of research data it is designed to communicate to the reader.
A psychologist is analyzing the results of a study where participants' stress levels were measured at three-month intervals (Month 3, Month 6, and Month 9). Arrange the following steps in the correct order to construct an APA-style line graph for these research findings.
In an APA-style line graph, a steep slope between two data points is sufficient evidence to conclude there is a meaningful difference between those levels of the independent variable, even if the error bars for those points overlap significantly.
In APA-style research reporting, what statistical value do the error bars plotted around the points on a line graph typically visualize?
In an APA-style line graph, the error bars extending from each plotted point are designed to visualize the entire range of individual participants' raw scores at that level of the independent variable.
A researcher presents an APA-style line graph connecting the mean scores () of three distinct, non-ordered categories (e.g., 'Group A', 'Group B', and 'Group C'). When evaluating this visualization for methodological accuracy, a reviewer would conclude that the connecting lines are inappropriate because they falsely suggest that the independent variable on the -axis is _____.
A research methods instructor presents four descriptions of APA-style line graph features or study designs. Match each description to the correct APA line graph principle it illustrates.
A researcher measures participants' subjective fatigue on a 10-point scale after 0, 2, 4, 6, and 8 hours of sleep deprivation, then constructs an APA-style line graph. When a peer reviewer challenges the use of connecting lines between data points instead of a bar graph, the researcher correctly defends the choice by explaining that the independent variable — hours of sleep deprivation — is measured _____, which is the key condition under which APA style recommends a line graph over other graph
A student is peer-reviewing a classmate's APA-style line graph from a study on caffeine dose (0 mg, 50 mg, 100 mg, 200 mg) and response speed. Arrange the following evaluative steps in the most logical order for systematically judging whether the graph meets APA standards and was the appropriate choice for this dataset.
According to APA style guidelines for line graphs, state the two conditions under which a line graph should be utilized in research reporting. Additionally, describe what each plotted point represents and what statistical value the error bars on these points typically visualize.
Explain why the psychologist's decision to use a line graph is appropriate based on the nature of their independent variable. Then, clarify what the vertical markings extending from each point represent and what specific statistical information they convey to the reader.
A researcher is constructing an APA-style line graph to show a correlation between two quantitative variables where the independent variable has three distinct levels of difficulty (low, medium, high) and the dependent variable is task performance. Applying APA guidelines, what should each plotted point on this graph represent, and what should the error bars extending from these points visualize?
Learn After
Under which condition is an APA-style line graph particularly useful for presenting experimental results?
Based on the standards for an APA-style line graph, match each visual component with the specific statistical or structural information it conveys to a researcher.
In the provided APA-style line graph (Figure 12.12), an analysis of the vertical error bars suggests that the difference in mean scores between Row and Row is more likely to be statistically significant than the difference between Row and Row because the error bars for Rows and do not overlap, whereas the error bars for Rows and show substantial overlap.
Based on the provided APA-style line graph, rank the following comparisons of mean scores from the strongest evidence of a statistically significant difference to the weakest evidence of a statistically significant difference. To evaluate the strength of evidence, consider both the vertical distance between the data points and the degree of overlap between the error bars.
In the provided example of an APA-style line graph (Figure 12.12), the vertical error bars extending from each data point represent the standard error.
In APA-style formatting, why is a line graph (as seen in Figure 12.12) preferred over a bar graph for displaying these specific results?
In the Carlson and Conard study, a line graph is used because 'Distance From Front of Room' is a quantitative variable. If the researchers had instead compared mean scores between two categorical groups, such as 'Morning Class' versus 'Evening Class', they should have used a(n) _____ graph to adhere to APA standards.
A researcher is preparing an APA-style line graph of Carlson and Conard's data. Match each research decision to the correct APA-style line graph principle or feature that addresses it.
When analyzing why Carlson and Conard's results are displayed as a line graph rather than a bar graph, the critical justification is that 'Distance from the Front of the Room' is a _____ variable, which makes it analytically meaningful to connect successive data points with a line to reveal a trend across its ordered levels.
A student is evaluating an APA-style line graph from Carlson and Conard's study in order to draw a justified, evidence-based conclusion. Rank the following interpretive steps in the order that produces the most logically defensible evaluation, from first (1) to last (6).
According to the provided text, identify the condition under which an APA-style line graph is particularly useful for presenting experimental results, and describe what the vertical error bars on the line represent.
Based on the provided text, justify why the researcher should choose an APA-style line graph over a bar graph, and explain what statistical properties the vertical error bars will communicate to the readers.
A researcher is plotting the results of a Carlson and Conard replication. If the mean score for a participant group is 75.0 and the standard error of that mean is 1.50, how should they apply this standard error value to draw the vertical error bar for this data point on an APA-style line graph?