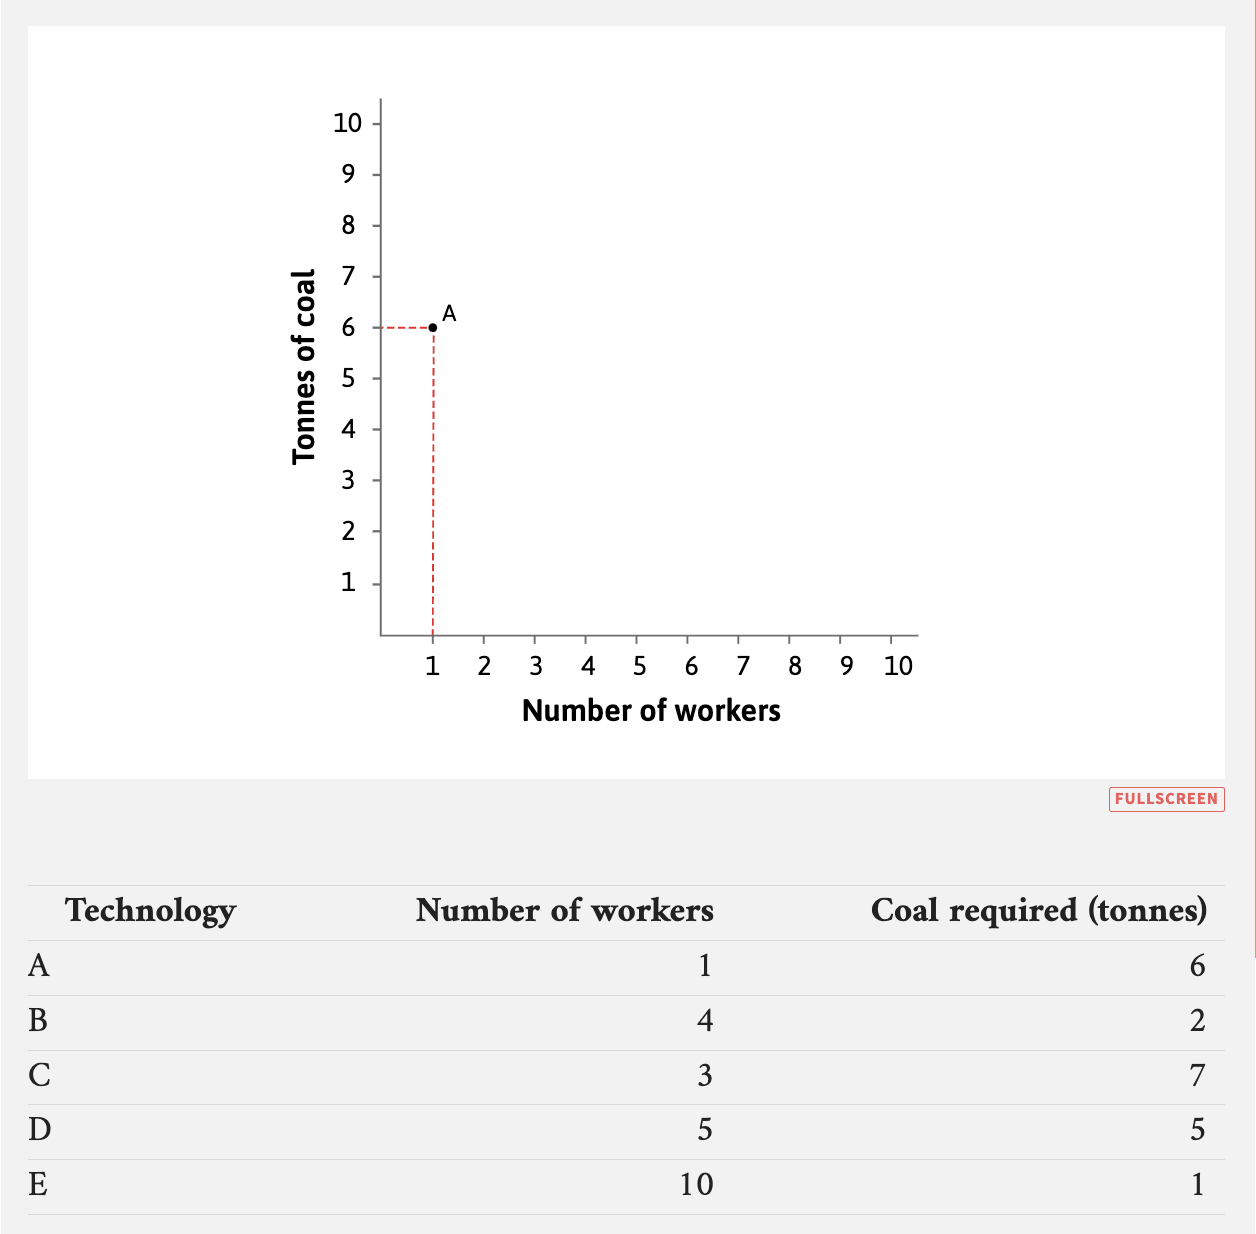
Technology A: An Energy-Intensive Method with Coordinates (1, 6)
Technology A is characterized as an energy-intensive production method. On a graph plotting labor (number of workers) against energy (tons of coal), it is represented by the coordinate point (1, 6), indicating that it requires 1 worker and 6 tons of coal. The fixed input proportion of this technology is visualized by a straight, upward-sloping line passing through point A, which demonstrates a coal-to-labor ratio of 6:1.
0
1
Contributors are:


Who are from:


Tags
Social Science
Empirical Science
Science
Economy
CORE Econ
The Economy 1.0 @ CORE Econ
Ch.2 Technology, Population, and Growth - The Economy 1.0 @ CORE Econ
Economics
Introduction to Microeconomics Course
Ch.2 Technology and incentives - The Economy 2.0 Microeconomics @ CORE Econ
The Economy 2.0 Microeconomics @ CORE Econ
Related
Technology C: Input Coordinates (3, 7)
Technology D: Input Coordinates (5, 5)
Technology E: Input Coordinates (10, 1) and Coal-to-Labor Ratio
Technology A: An Energy-Intensive Method with Coordinates (1, 6)
Figure 2.6: The Five Available Technologies for Cloth Production
Drawing Conclusions from Figure 2.10
Technology B: A Labor-Intensive Method with Coordinates (4, 2)
A firm can produce 100 meters of cloth using one of the four technologies listed below. Each technology requires a specific combination of labor (number of workers) and energy (tons of coal).
- Technology A: 1 worker, 6 tons of coal
- Technology B: 4 workers, 2 tons of coal
- Technology C: 3 workers, 7 tons of coal
- Technology D: 10 workers, 1 ton of coal
Assuming the firm's goal is to minimize costs, which technology would it be irrational for the firm to ever choose, regardless of the wages for labor or the price of coal?
Cost-Minimizing Technology Choice
A firm produces 100 meters of cloth. Initially, the wage is £10 per worker and the price of coal is £20 per ton. Under these conditions, the firm uses 'Technology B' (4 workers, 2 tons of coal), as it is the most cost-effective option. Now, imagine the wage for workers rises to £30, while the price of coal remains at £20 per ton. Given the available technologies below, which one will the firm switch to in order to minimize its costs?
A firm can produce 100 meters of cloth using various technologies, each defined by a specific combination of labor (workers) and energy (tons of coal). Analyze the input requirements for each technology listed below and match it to the correct description of its input intensity.
A firm analyzes several technologies, represented as points on a graph with labor on the horizontal axis and energy on the vertical axis. An isocost line is drawn, showing all combinations of labor and energy that cost exactly £1000. What can be concluded about a technology if its corresponding point lies in the region of the graph above the £1000 isocost line?
Impact of Input Price Changes on Technology Choice
A firm uses a model to decide which production technology to use. The model is represented on a graph where the horizontal axis measures the number of workers (labor) and the vertical axis measures the tonnes of coal (energy). Isocost lines are drawn on this graph to show all combinations of labor and energy that result in the same total cost. What does the slope of an isocost line represent in this model?
Evaluating a Firm's Technology Investment Decision
A manufacturing firm uses a model to select the most cost-effective production technology. This model is visualized on a graph where the horizontal axis represents the number of workers (labor) and the vertical axis represents tons of coal (energy). An isocost line on this graph shows all combinations of labor and coal that have the same total cost. If the price of coal increases while the wage for labor stays the same, how will the isocost line change?
Minimizing Production Costs
Trade-off Between Labor Productivity and Energy Intensity in Competing Technologies
Technology E: Input Coordinates (10, 1) and Coal-to-Labor Ratio
Technology A: An Energy-Intensive Method with Coordinates (1, 6)
Technology B: A Labor-Intensive Method with Coordinates (4, 2)
A graph is used to compare three different technologies (P, Q, and R) available for producing 100 units of a product. The horizontal axis represents the number of workers, and the vertical axis represents the tons of energy required. The input combinations for each technology are as follows: Technology P=(2 workers, 8 tons of energy), Technology Q=(5 workers, 5 tons of energy), and Technology R=(8 workers, 2 tons of energy). If the price of energy were to increase substantially while wages remained constant, which technology would experience the greatest increase in its total production cost?
A graph is used to represent two different production technologies, Technology X and Technology Y, for producing a specific quantity of a good. The horizontal axis measures units of labor, and the vertical axis measures units of energy. Technology X is represented by the point (2, 8), meaning it requires 2 units of labor and 8 units of energy. Technology Y is represented by the point (5, 5), requiring 5 units of labor and 5 units of energy. Which statement correctly analyzes the relationship between these two technologies?
Technology Investment Decision
A graph is used to represent four different production technologies. The horizontal axis measures the number of workers (labor), and the vertical axis measures tons of energy. Given the input requirements for each technology below, match each technology to its correct description.
On a graph where the vertical axis represents units of energy and the horizontal axis represents units of labor, Technology B, which requires 10 units of energy and 5 units of labor to produce a certain output, is considered more energy-intensive than Technology A, which requires 9 units of energy and 3 units of labor for the same output.
Interpreting Technology Rays
Justifying Technology Choice Under Shifting Economic Conditions
A manufacturing firm is analyzing four potential production technologies (Alpha, Beta, Gamma, Delta) for creating a standard product batch. Each technology is defined by its input requirements on a graph where the horizontal axis represents the number of workers (labor) and the vertical axis represents the units of energy consumed. The input combinations are as follows:
- Technology Alpha: (2 workers, 10 units of energy)
- Technology Beta: (8 workers, 4 units of energy)
- Technology Gamma: (4 workers, 8 units of energy)
- Technology Delta: (5 workers, 5 units of energy)
Arrange these technologies in order from the MOST energy-intensive to the LEAST energy-intensive.
On a graph where the horizontal axis represents units of labor and the vertical axis represents units of energy, a ray is drawn from the origin through the point (5, 10) to represent Technology X. Another ray for Technology Y passes through the point (8, 12). For every one unit of labor, Technology X uses ______ more units of energy than Technology Y.
On a graph where the horizontal axis represents units of labor and the vertical axis represents units of energy, two different production technologies, M and N, are each represented by a straight line (ray) starting from the origin. The ray representing Technology M is steeper than the ray representing Technology N. What can be definitively concluded from this information?
Figure 2.4: Graphical Comparison of Fixed-Proportions Technologies
Technology C: Input Coordinates (3, 7)
Technology D: Input Coordinates (5, 5)
Technology A: An Energy-Intensive Method with Coordinates (1, 6)
Technology E: Input Coordinates (10, 1) and Coal-to-Labor Ratio
Technology B: A Labor-Intensive Method with Coordinates (4, 2)
A graph is used to compare different methods for producing a fixed amount of a good. The horizontal axis measures the number of workers, and the vertical axis measures the tons of coal required. Consider two production methods shown on this graph: Method X is at the coordinate (2, 9) and Method Y is at the coordinate (8, 3). Based on this information, which of the following statements is an accurate comparison of the two methods?
A standard economic graph is used to visualize different production methods for a set amount of output. The horizontal axis represents the number of workers (labor), and the vertical axis represents the amount of energy (in tons of coal). Match each described production method to its correct coordinate pair on this graph.
A graph is used to compare different technologies for producing a fixed quantity of a good. The horizontal axis represents the number of workers, and the vertical axis represents tons of coal. A company is evaluating four new technologies represented by the following coordinate pairs: Technology P (2, 8), Technology Q (4, 4), Technology R (7, 2), and Technology S (9, 1). If the company's main priority is to minimize its energy consumption (coal), which technology is the most suitable choice?
Evaluating a Production Technology Shift
Analyzing a Shift in Production Technology
A firm is analyzing two different technologies to produce 100 units of a product. The production process is visualized on a graph where the horizontal axis represents the number of workers and the vertical axis represents tons of coal. Technology Alpha is located at the coordinate (2, 10), and Technology Beta is at (9, 3). Which of the following statements provides the most accurate evaluation of the choice between these two technologies?
On a graph used to compare production methods, the horizontal axis measures the number of workers and the vertical axis measures tons of coal. True or False: A production method represented by the coordinate point (8, 2) is more labor-intensive than a method represented by the point (2, 8).
A company's current technology for producing a fixed quantity of a good requires 6 workers and 6 tons of coal. The company is evaluating four alternative technologies, represented on a graph where the horizontal axis is 'number of workers' and the vertical axis is 'tons of coal'. Which of the following alternatives represents an unambiguous technological improvement, meaning it uses less of at least one input without using more of the other?
Determining New Technology Coordinates
On a graph where the horizontal axis represents the number of workers and the vertical axis represents tons of coal, a specific production technology is located at the coordinate point (6, 3). To produce the standard amount of output, this technology requires 6 workers and ____ tons of coal.
Learn After
A manufacturing process for producing 100 metres of cloth requires 1 worker and 6 tons of coal. A new, alternative process is discovered that can produce the same amount of cloth but requires 2 workers and 10 tons of coal. How does the energy intensity (coal used per worker) of the new process compare to the original process?
Production Technology Consistency
Scaling Production Inputs
Technology Selection under Resource Constraints
On a graph where the horizontal axis represents the number of workers and the vertical axis represents tons of coal, a specific production process for a fixed output is represented by the point (1, 6). Which of the following points represents a different process that is more labor-intensive (i.e., has a lower coal-to-worker ratio)?
Maintaining Production Ratios
A textile firm can produce a standard batch of cloth using two different methods. Method X is energy-intensive, requiring 1 worker and 6 tons of coal. Method Y is labor-intensive, requiring 4 workers and 2 tons of coal. Initially, the wage for one worker is $20, and the price of one ton of coal is $10. Due to new regulations, the price of coal rises to $30 per ton, while the wage remains unchanged. Based on a total cost comparison, which statement correctly evaluates the impact of this price change?
Evaluating a Technology Upgrade
A factory uses a production method that requires 1 worker and 6 tons of coal to produce a standard batch of output. On a graph with the number of workers on the horizontal axis and tons of coal on the vertical axis, any point lying on the straight line connecting the origin (0,0) to the point (2,12) represents a valid combination of inputs for producing some amount of output using this same method.
Evaluating a Production Plan