Learn Before
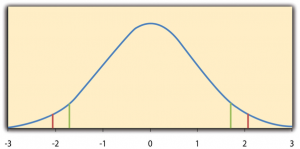
Distribution of t Scores
The distribution illustrates the spread of possible scores that researchers would expect to observe if the null hypothesis were entirely true. This distribution forms a unimodal and symmetrical curve centered precisely around a mean of . By utilizing this known distribution curve, researchers can evaluate any computed score to find its exact -value, which represents the proportion of expected scores that are at least as extreme as the observed sample result.
0
1
Tags
KPU
Research Methods in Psychology - 4th American Edition @ KPU
Related
Distribution of t Scores
Degrees of Freedom
Distribution of Scores
During hypothesis testing, what is the term for the specialized numerical value computed from sample data that serves as an intermediate step to evaluate the probability of obtaining the observed results if the null hypothesis were true?
In the process of hypothesis testing, a test statistic serves as a crucial bridge between raw data and a final decision. Arrange the following steps in the correct logical order to show how a test statistic is used to evaluate a research claim.
A researcher is investigating whether a new meditation app reduces stress levels. Match each element of their statistical analysis to its correct role in the hypothesis testing process.
In psychological research, a test statistic is often conceptualized as a ratio of the 'signal' (the observed effect) to the 'noise' (the random variability or error in the data). If a researcher conducts a study where the 'noise' is significantly reduced through better experimental control while the 'signal' remains the same, the numerical value of the test statistic will ________.
In a peer-review report, a researcher evaluates a study by stating that the test statistic is the final objective measure that represents the probability of the observed data occurring by chance. This evaluation of the test statistic's role is correct.
A social psychologist is developing a novel research paradigm to study 'Interpersonal Synchrony' and needs to design a new test statistic () to evaluate their data. Which of the following procedural blueprints would correctly construct this test statistic so that it can be used to evaluate the probability of obtaining the observed results if the null hypothesis () were true?
Hypothesis Test of the Correlation Coefficient
In the context of hypothesis testing, a test statistic is a specialized numerical value computed from sample data that serves as an intermediate step to determine the -value.
In psychological research, hypothesis testing involves several interconnected components. Match each component to the statement that best describes its role or conceptual relationship to the test statistic.
A developmental psychologist is studying whether children who attend preschool have higher empathy scores than those who do not. After collecting sample data from a group of children, she calculates a raw mean difference in empathy scores. To help determine the -value, she standardizes this result to obtain a value of . In this psychological research design, the computed value of 2.41 is the ____.
A health psychologist is analyzing data from a study comparing stress reduction between a mindfulness group and a control group using an independent-samples -test. Conceptually, a test statistic is a ratio of the 'signal' (the observed difference between group means) to the 'noise' (the standard error, which depends on sample variance and sample size).
Assume a baseline study design yields a positive test statistic of .
Analyze the following four modified versions of this stud
One-Sample t-Test
Dependent-Samples t-Test
Independent-Samples t-Test
Reporting t-Test Results in APA Style
Analysis of Variance
Distribution of t Scores
What is the primary statistical function of a t-test in psychological research?
Although there are different variations of the t-test to accommodate various research designs, its fundamental purpose is to serve as a null hypothesis test evaluating the statistical relationship between exactly two means.
Match each psychology research scenario with the specific variation of the -test required to evaluate the relationship between the means.
A psychology researcher is using a -test to evaluate the relationship between two means. Arrange the components of the statistical logic in the correct order to reflect how the procedure differentiates an observed effect from chance variation.
To evaluate the statistical relationship between two means, a researcher must judge whether the observed difference is large enough to reject the _____ hypothesis, which serves as the baseline assumption that no true relationship exists in the population.
Learn After
Degrees of Freedom (One-Sample t-Test)
What does the t distribution specifically illustrate?
Based on the provided image of the distribution of t scores, match each mathematical characteristic with its conceptual meaning in psychological research.
A researcher is evaluating potential results from a study on how caffeine affects memory. Based on the provided image of the distribution curve and assuming the null hypothesis is true, arrange the following possible scores in order from the MOST likely to occur to the LEAST likely to occur.
In a distribution, an observed score of will yield a larger -value than a score of because the distribution's unimodal shape and center at zero mean that values closer to the mean represent a larger proportion of results expected if the null hypothesis is true.
A researcher is constructing a set of four hypothetical sample results ( scores) to 'create' a visual model that perfectly aligns with the properties shown in the provided image of the distribution. They have already generated two scores: and . To complete the set so that it is both perfectly symmetrical and centered at precisely , which two additional scores must they generate?
A researcher argues that a calculated score of is 'less extreme' than a score of because the negative sign makes it a 'smaller' number. This reasoning is flawed because the distribution is _____, meaning that a score's distance from — not its sign — determines how extreme it is relative to the null hypothesis.
The distribution illustrates the spread of possible scores that researchers would expect to observe if the _____ were entirely true.
A researcher obtains a score of and uses the distribution to evaluate how consistent this result is with the null hypothesis. They conclude that is just as extreme as and would therefore produce the same -value. This conclusion is correct.
Match each feature of the distribution to the statement that correctly explains its role in hypothesis testing.
A student argues that a score of provides stronger evidence against the null hypothesis than a score of because the negative sign indicates an 'opposite' result. Arrange the following evaluative steps in the correct order to judge whether this reasoning is valid.
Describe the graphical shape, the exact numerical value of the center, and the overall purpose of the distribution in psychological research.
Explain why the distribution is centered precisely at in this context, and explain how the researcher uses this curve to determine the -value for their computed score.
If a researcher calculates a score of in a psychological study, how do they apply the distribution to find the corresponding -value, and what does this -value represent?
Example of Finding a -Value for a Score