Learn Before
Example of Graphing Factorial Experiments
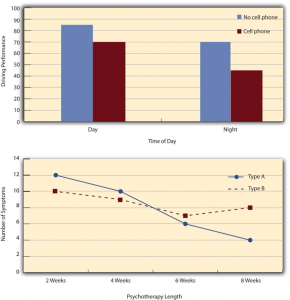
Graphical representations of factorial experiments vary based on the nature of the variables involved. For instance, in a design, researchers might use a bar graph with a categorical variable like 'time of day' on the -axis and 'cell phone use' indicated by different colored bars. Conversely, for a design that includes a quantitative variable, a line graph is typically used; here, the quantitative variable, such as 'psychotherapy length', is placed on the -axis, while the categorical variable, like 'psychotherapy type', is represented by distinct line formats.
0
1
Tags
KPU
Research Methods in Psychology - 4th American Edition @ KPU
Related
Assigning Variables in Factorial Graphs
Line Graphs in Factorial Designs
Example of Graphing Factorial Experiments
Graphing Interactions
Match each variable in a factorial experiment with two independent variables to its standard graphical representation.
A psychology student is creating a graph for a factorial experiment investigating the effects of room temperature and background noise on reading comprehension scores. Based on standard graphing conventions for factorial designs, how should the student assign the variables to the graph's visual elements?
A researcher presents a graph of a study on 'Therapy Type' and 'Session Frequency'. The x-axis contains two labels ('Behavioral', 'Cognitive') and the legend displays three differently colored lines representing 'Session Frequency'. Based on standard graphing conventions, a student can correctly conclude that this study involved one variable with two levels and another variable with three levels.
A researcher is peer-reviewing a graph intended to display the results of a factorial experiment with two independent variables. To systematically evaluate the graph's adherence to standard reporting conventions, in what order should the researcher verify the following components, starting with the element that defines the primary measurement scale?
To produce a standard graphical synthesis of a study involving two independent variables, a researcher must systematically map each variable type to a specific visual component. Arrange the following steps to construct this visualization, starting from its foundational measurement scale to its final integration of data.
In a standard graph of a factorial experiment with two independent variables, which variable is plotted along the -axis?
When graphing the results of a factorial experiment with two independent variables, researchers typically plot one independent variable along the -axis and the second independent variable along the -axis.
A researcher conducts a factorial experiment examining how caffeine dosage (none, low, high) and study environment (quiet room vs. noisy room) affect memory recall scores. When graphing the results, caffeine dosage is plotted along the x-axis, and two differently colored bars represent the two study environments. Memory recall scores must be plotted on the _____ axis.
A researcher is analyzing a graph representing a factorial design with two independent variables. Match each graphical representation to the correct variable type it displays based on standard graphing conventions.
A peer reviewer is evaluating a draft graph of a factorial design study. The graph correctly represents the first independent variable on the -axis and the second independent variable using distinct line formats, but it has mistakenly plotted the dependent variable along the -axis as well. To correct this visualization error and follow standard conventions, the researcher must move the dependent variable to the _____.
In a factorial experiment with two independent variables, explain the standard conventions for graphing the results. In your description, specify where each of the two independent variables and the dependent variable should be plotted or represented.
Describe how the research team should set up their graph to follow standard conventions for factorial experiments. Specify how each of the three variables (Room Lighting, Study Method, and Exam Score) should be visually represented.
A researcher is graphing a factorial experiment with two independent variables: 'Feedback Type' and 'Practice Schedule'. If they plot 'Feedback Type' on the -axis and 'Performance Score' (the dependent variable) on the -axis, how should they visually represent 'Practice Schedule' on the graph?
Learn After
When graphing the results of a factorial experiment that includes one quantitative independent variable (e.g., length of psychotherapy) and one categorical independent variable (e.g., type of psychotherapy), which type of graph is typically used?
In psychology research, the way factorial experiments are graphed depends on the nature of the variables. Match each graphical element with the specific variable type and role it represents in the examples described.
A researcher is graphing the results of a factorial experiment studying the effects of 'Medication Dosage' (0mg, 50mg, 100mg) and 'Patient Age' (Young vs. Old) on recovery time. To correctly apply the standard research conventions shown in the provided examples, the researcher should place 'Medication Dosage' on the x-axis of a line graph.
A researcher is visualizing the results of a factorial study examining 'Medication Dosage' (0, 10, 20, or 30mg) and 'Patient Age' (Young vs. Old) on 'Recovery Time.' Sequence the steps of the analytical process to correctly organize these variables into a line graph according to standard psychology research conventions.
In a bar graph used to represent a $2 imes 2factorial experiment with a categorical variable on thex$$-axis, how are the levels of the second independent variable typically distinguished?
According to standard conventions in psychology research, a bar graph is typically preferred over a line graph to represent factorial designs that include a quantitative independent variable.
A peer reviewer evaluates a researcher's decision to use a bar graph for a factorial design where 'Time Elapsed' (10, 20, 30, 40, or 50 minutes) is the independent variable on the -axis. The reviewer concludes that a line graph is more appropriate because 'Time Elapsed' is a _____ variable, and conventions suggest using lines to better represent functional relationships between such numerical levels.
A research team must choose how to graph results from several factorial experiments. Match each study description or graph element on the left to the correct graphing decision or representational role on the right.
A student examines two published factorial-experiment graphs. Graph A depicts a study with 'feedback type' (positive vs. negative) on the x-axis and 'study method' (active vs. passive) shown as differently colored bars. Graph B depicts a study with 'practice duration' (1, 2, 3, or 4 weeks) on the x-axis and 'instruction style' (lecture vs. discussion) shown as differently formatted lines. After comparing the two graphs, the student identifies that the structural rea
A researcher receives peer-review feedback that their graph for a factorial study is incorrectly formatted: the categorical IV ('therapy type': CBT vs. DBT) was placed on the x-axis, and the quantitative IV ('session count': 4, 8, 12, or 16 sessions) was represented by differently colored bars. Sequence the steps the researcher should follow to evaluate and correct this graphing error.
Based on the graphing conventions for factorial experiments, describe how the choice of graph type differs when using categorical versus quantitative variables. In your response, describe the specific graphical setup for a design with categorical variables and a design that includes a quantitative variable, specifying what is placed on the -axis and how the second variable is represented.
Explain why the student's proposed bar graph setup is inappropriate for presenting the results of this factorial design based on standard graphing conventions. Describe what type of graph should be used instead and how the variables should be correctly arranged on it.
A psychology researcher conducts a factorial experiment examining the effects of a quantitative independent variable, 'Dosage of Drug' (with levels: 5mg, 10mg, 15mg), and a categorical independent variable, 'Patient Gender' (with levels: Male, Female). Applying standard psychology graphing conventions, state the type of graph that should be used and explain how these two independent variables must be represented on it.