Graphing Interactions
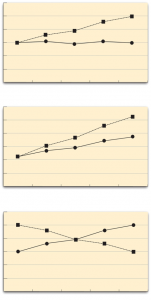
Interaction effects in factorial experiments can be visually interpreted and analyzed using either bar graphs or line graphs. In these visualizations, spreading interactions are identifiable when there is a large difference in the dependent variable at one level but little to no difference at the other. Cross-over interactions are characterized by a distinct reversal in the pattern of bar heights or by line graphs where the plotted lines literally intersect and cross over one another.
0
1
Tags
KPU
Research Methods in Psychology - 4th American Edition @ KPU
Related
Spreading Interaction
Cross-over Interaction
Graphing Interactions
In a factorial research design, which of the following best describes a cross-over interaction?
A researcher finds that a new studying technique improves test scores for students with high anxiety, but has absolutely no effect on test scores for students with low anxiety. This pattern is an example of a cross-over interaction.
A researcher is analyzing the results of a 2x2 factorial experiment investigating how 'Instructional Method' (Direct Instruction vs. Problem-Based Learning) and 'Prior Knowledge' (Low vs. High) interact to affect exam scores. Arrange the analytical steps in the correct logical order to determine if a cross-over interaction is present.
A researcher is constructing a model of 'In-Group Cooperation' that predicts a 'spreading interaction' between 'Incentive Structure' (Group vs. Individual) and 'Team Identity' (High vs. Low). Specifically, group incentives are hypothesized to significantly boost effort compared to individual incentives only for 'High Identity' teams, with no difference for 'Low Identity' teams. To synthesize a data table for this theory, which set of mean effort scores (on a scale of to ) should the
In a factorial research design, a spreading interaction is characterized by one independent variable having opposite effects depending on the level of a second independent variable.
A researcher evaluates a claim that a specific study technique is 'universally superior' for all students. The data show the technique improves performance for students with high prior knowledge but hurts performance for students with low prior knowledge. Because the direction of the effect reverses across groups, the researcher identifies this pattern as a(n) _____ interaction.
Match each pattern of results from a factorial design with the description that best characterizes how the effect of one independent variable relates to the levels of a second independent variable.
A student reads a psychology article stating that a new therapy reduces symptoms significantly for patients with a strong support system, but has almost no impact on patients without a support system. Because the therapy's effect is present in one group but virtually absent in the other, the student correctly summarizes this pattern as a ____ interaction.
A clinical psychologist wants to demonstrate a spreading interaction between a new cognitive therapy and patients' baseline anxiety levels. Arrange the steps the psychologist must take to hypothesize, test, and visually confirm this specific interaction pattern.
Analyze the outcomes of the following factorial research scenarios. Match each pattern of results with the term that best classifies the complex relationship between the variables.
Graphing Interactions
Which of the following best describes the statistical pattern known as a spreading interaction?
A spreading interaction can be described conceptually or identified visually in different types of charts. Match each representation of a spreading interaction with its specific description.
A researcher finds that a new mindfulness app significantly reduces stress for individuals with high-pressure jobs, but has no measurable effect on stress for individuals with low-pressure jobs. This pattern of results is an example of a spreading interaction.
Rank the following hypothetical research findings from the pattern that most strongly aligns with the definition of a 'spreading interaction' to the pattern that least aligns with it, based on the magnitude of the simple effects of Independent Variable A at each level of Independent Variable B.
In a $2 \times 2$$ factorial design, a spreading interaction typically appears on a bar graph as a significant difference in bar heights in one condition, contrasting with minimal differences in the other.
In a factorial study, a researcher finds that a 'Sleep Deprivation' condition (Deprived vs. Rested) significantly impairs reaction time for 'Older Adults' but has no measurable effect on the reaction time of 'Younger Adults.' Why does this pattern qualify as a spreading interaction?
In a study using a factorial design, a researcher finds that the simple effect of the independent variable at Level 1 of the moderator is null (), while the simple effect at Level 2 is large and statistically significant (). By analyzing the relationship between these two distinct simple effects, the researcher can identify the result as a(n) _____.
Match each hypothetical research outcome description to the type of visual pattern it would produce on a graph, based on the definition of a spreading interaction.
An analyst examines a line graph representing a factorial design. They observe that the lines for the two groups are completely parallel in one condition but strongly diverge in the other condition. The analyst should conclude that this pattern of results represents a _____ interaction.
Order the steps a researcher must take to evaluate a visual plot and determine if the data represents a spreading interaction.
Graphing Interactions
How is a cross-over interaction defined in the context of factorial designs?
A researcher finds that background music increases the productivity of employees performing simple, repetitive tasks but decreases the productivity of employees performing complex, cognitive tasks. Because the effect of the music reverses direction depending on the type of task, a graph of these results would show a cross-over interaction.
A researcher discovers a cross-over interaction between 'Audience Presence' (Alone vs. Observed) and 'Skill Level' (Expert vs. Novice) regarding performance accuracy. Match each element of this study to the characteristic that would produce this specific interaction pattern.
A researcher investigates the interaction between 'Room Temperature' (Cold vs. Hot) and 'Beverage Preference' (Hot Soup vs. Iced Water). In a 'Cold Room', participants rate 'Hot Soup' as significantly more enjoyable than 'Iced Water'. To qualify as a cross-over interaction, the enjoyment ratings for 'Iced Water' in a 'Hot Room' must be ________ than the ratings for 'Hot Soup'.
A researcher is evaluating whether a dataset from a factorial study constitutes a cross-over interaction. Arrange the evaluative steps in the correct logical order to justify concluding that this specific interaction pattern is the most accurate description of the relationship.
A researcher is designing a new experiment to test how 'Textbook Format' (Digital vs. Print) interacts with 'Student Preference' (Prefer Digital vs. Prefer Print) to affect 'Exam Scores'. To construct a cross-over interaction in this study's design, which hypothesis should the researcher propose?
A ________ interaction occurs when an independent variable has an effect at both levels of a second independent variable, but these effects operate in completely opposite directions.
A researcher examines how study environment (Quiet vs. Noisy) interacts with learning style (Visual vs. Auditory) on test scores. Visual learners score higher in the Quiet condition than the Noisy condition, while Auditory learners score higher in the Noisy condition than the Quiet condition. The researcher concludes that a cross-over interaction has occurred.
A researcher plots results from a 2×2 factorial study. Analyze each interaction graph pattern described below and match it to the correct interpretation.
A student is critically evaluating a published study in which the authors claim to have found a cross-over interaction in a 2×2 factorial design. Arrange the evaluative steps in the correct logical order to judge whether the authors' claim is justified.
Define a cross-over interaction in terms of the effects of independent variables in a factorial design, and describe how this type of interaction is visually represented on a graph.
Based on this scenario, explain why these findings demonstrate a cross-over interaction. In your explanation, link the specific experimental outcomes to the definition of a cross-over interaction and describe the graphical representation.
A researcher is planning an experiment investigating how 'Study Environment' (Quiet vs. Noisy) and 'Student Personality' (Introvert vs. Extrovert) interact to affect exam scores. If Introverts perform better in a Quiet environment than a Noisy environment, predict the performance pattern for Extroverts that would be required to produce a cross-over interaction, and describe what the graphed lines would do.
Example of a Cross-over Interaction: Caffeine and Personality
Assigning Variables in Factorial Graphs
Line Graphs in Factorial Designs
Example of Graphing Factorial Experiments
Graphing Interactions
Match each variable in a factorial experiment with two independent variables to its standard graphical representation.
A psychology student is creating a graph for a factorial experiment investigating the effects of room temperature and background noise on reading comprehension scores. Based on standard graphing conventions for factorial designs, how should the student assign the variables to the graph's visual elements?
A researcher presents a graph of a study on 'Therapy Type' and 'Session Frequency'. The x-axis contains two labels ('Behavioral', 'Cognitive') and the legend displays three differently colored lines representing 'Session Frequency'. Based on standard graphing conventions, a student can correctly conclude that this study involved one variable with two levels and another variable with three levels.
A researcher is peer-reviewing a graph intended to display the results of a factorial experiment with two independent variables. To systematically evaluate the graph's adherence to standard reporting conventions, in what order should the researcher verify the following components, starting with the element that defines the primary measurement scale?
To produce a standard graphical synthesis of a study involving two independent variables, a researcher must systematically map each variable type to a specific visual component. Arrange the following steps to construct this visualization, starting from its foundational measurement scale to its final integration of data.
In a standard graph of a factorial experiment with two independent variables, which variable is plotted along the -axis?
When graphing the results of a factorial experiment with two independent variables, researchers typically plot one independent variable along the -axis and the second independent variable along the -axis.
Learn After
Bar Graphs of Interactions
Line Graphs of Interactions
When visually analyzing the results of a factorial experiment on a line graph, what specific pattern characterizes a cross-over interaction?
A researcher finds that a specific memory technique improves recall for lists of abstract words but has no effect on recall for lists of concrete words. True or False: If these results were plotted on a line graph, the visual pattern where the lines for 'Technique' and 'Control' are far apart at the 'abstract' level but meet at the 'concrete' level would be correctly identified as a cross-over interaction.
A researcher conducts a factorial experiment to study the effects of 'Noise Level' (Quiet vs. Loud) and 'Task Complexity' (Simple vs. Complex) on participant accuracy. The data reveals that while noise level has no impact on accuracy for simple tasks, loud noise significantly reduces accuracy for complex tasks. When analyzing the visual representation of these results on a line graph—where the lines for the two groups meet at the 'Simple' level but move far apart at the 'Complex' l
A researcher is evaluating a graph from a $2 imes 2$$ factorial experiment to determine if the data supports a 'cross-over' interaction. Arrange the following steps in the correct logical sequence to evaluate this scientific claim.
The provided line graph represents a cross-over interaction.
The provided image displays both a line graph and a bar graph of the same data from a factorial experiment. Based on the visual patterns shown, which statement correctly explains why this is classified as a spreading interaction?
In factorial experiments, researchers use line graphs to visually identify interaction effects. Match each type of interaction to the visual pattern it produces on a line graph.
A research methods class is analyzing different graphical outputs of factorial designs. Match each researcher's graphical observation to the correct interaction classification it represents.
A researcher is analyzing the results of a factorial experiment. On the line graph, they notice that the line for the control group remains completely flat across both levels of the treatment condition, while the line for the experimental group increases sharply. This visual pattern of a difference at one level but no difference at the other level indicates the presence of a _____ interaction.
A student needs to evaluate a newly generated line graph from a factorial experiment to determine whether it depicts a spreading interaction, a cross-over interaction, or no interaction. Order the steps they should take to reach a justified conclusion.
Describe how researchers can visually identify both spreading and cross-over interactions in factorial experiments using bar graphs or line graphs, based on the patterns of the variables.
Based on the team's findings, diagnose which type of interaction effect is present in this study, and explain how this pattern would look visually on a graph.
A researcher is plotting the results of a factorial experiment where the effectiveness of two teaching methods completely reverses depending on whether the students are introverts or extroverts. If the researcher decides to visualize this cross-over interaction using a line graph, describe what the lines will do.