
Learn Before
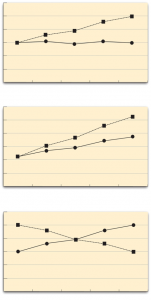
The provided image displays both a line graph and a bar graph of the same data from a factorial experiment. Based on the visual patterns shown, which statement correctly explains why this is classified as a spreading interaction?
0
1
Tags
KPU
Research Methods in Psychology - 4th American Edition @ KPU
Related
Bar Graphs of Interactions
Line Graphs of Interactions
When visually analyzing the results of a factorial experiment on a line graph, what specific pattern characterizes a cross-over interaction?
A researcher finds that a specific memory technique improves recall for lists of abstract words but has no effect on recall for lists of concrete words. True or False: If these results were plotted on a line graph, the visual pattern where the lines for 'Technique' and 'Control' are far apart at the 'abstract' level but meet at the 'concrete' level would be correctly identified as a cross-over interaction.
A researcher conducts a factorial experiment to study the effects of 'Noise Level' (Quiet vs. Loud) and 'Task Complexity' (Simple vs. Complex) on participant accuracy. The data reveals that while noise level has no impact on accuracy for simple tasks, loud noise significantly reduces accuracy for complex tasks. When analyzing the visual representation of these results on a line graph—where the lines for the two groups meet at the 'Simple' level but move far apart at the 'Complex' l
A researcher is evaluating a graph from a $2 imes 2$$ factorial experiment to determine if the data supports a 'cross-over' interaction. Arrange the following steps in the correct logical sequence to evaluate this scientific claim.
The provided line graph represents a cross-over interaction.
The provided image displays both a line graph and a bar graph of the same data from a factorial experiment. Based on the visual patterns shown, which statement correctly explains why this is classified as a spreading interaction?
In factorial experiments, researchers use line graphs to visually identify interaction effects. Match each type of interaction to the visual pattern it produces on a line graph.
A research methods class is analyzing different graphical outputs of factorial designs. Match each researcher's graphical observation to the correct interaction classification it represents.
A researcher is analyzing the results of a factorial experiment. On the line graph, they notice that the line for the control group remains completely flat across both levels of the treatment condition, while the line for the experimental group increases sharply. This visual pattern of a difference at one level but no difference at the other level indicates the presence of a _____ interaction.
A student needs to evaluate a newly generated line graph from a factorial experiment to determine whether it depicts a spreading interaction, a cross-over interaction, or no interaction. Order the steps they should take to reach a justified conclusion.
Describe how researchers can visually identify both spreading and cross-over interactions in factorial experiments using bar graphs or line graphs, based on the patterns of the variables.
Based on the team's findings, diagnose which type of interaction effect is present in this study, and explain how this pattern would look visually on a graph.
A researcher is plotting the results of a factorial experiment where the effectiveness of two teaching methods completely reverses depending on whether the students are introverts or extroverts. If the researcher decides to visualize this cross-over interaction using a line graph, describe what the lines will do.