
Learn Before
Bar Graphs of Interactions
When interaction effects are depicted using bar graphs, specific visual patterns emerge. In a spreading interaction, the height difference between the comparison bars is prominent at one level of the independent variable on the horizontal axis, while there is little to no difference between the bars at the second level. Conversely, for a cross-over interaction, the relative pattern of the bar heights completely reverses between the two levels of the variable.
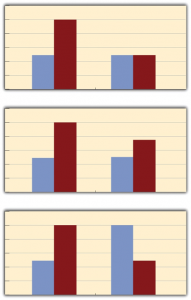
0
1
Tags
KPU
Research Methods in Psychology - 4th American Edition @ KPU
Related
Bar Graphs of Interactions
Line Graphs of Interactions
When visually analyzing the results of a factorial experiment on a line graph, what specific pattern characterizes a cross-over interaction?
A researcher finds that a specific memory technique improves recall for lists of abstract words but has no effect on recall for lists of concrete words. True or False: If these results were plotted on a line graph, the visual pattern where the lines for 'Technique' and 'Control' are far apart at the 'abstract' level but meet at the 'concrete' level would be correctly identified as a cross-over interaction.
A researcher conducts a factorial experiment to study the effects of 'Noise Level' (Quiet vs. Loud) and 'Task Complexity' (Simple vs. Complex) on participant accuracy. The data reveals that while noise level has no impact on accuracy for simple tasks, loud noise significantly reduces accuracy for complex tasks. When analyzing the visual representation of these results on a line graph—where the lines for the two groups meet at the 'Simple' level but move far apart at the 'Complex' l
A researcher is evaluating a graph from a $2 imes 2$$ factorial experiment to determine if the data supports a 'cross-over' interaction. Arrange the following steps in the correct logical sequence to evaluate this scientific claim.
The provided line graph represents a cross-over interaction.
The provided image displays both a line graph and a bar graph of the same data from a factorial experiment. Based on the visual patterns shown, which statement correctly explains why this is classified as a spreading interaction?
In factorial experiments, researchers use line graphs to visually identify interaction effects. Match each type of interaction to the visual pattern it produces on a line graph.
A research methods class is analyzing different graphical outputs of factorial designs. Match each researcher's graphical observation to the correct interaction classification it represents.
A researcher is analyzing the results of a factorial experiment. On the line graph, they notice that the line for the control group remains completely flat across both levels of the treatment condition, while the line for the experimental group increases sharply. This visual pattern of a difference at one level but no difference at the other level indicates the presence of a _____ interaction.
A student needs to evaluate a newly generated line graph from a factorial experiment to determine whether it depicts a spreading interaction, a cross-over interaction, or no interaction. Order the steps they should take to reach a justified conclusion.
Describe how researchers can visually identify both spreading and cross-over interactions in factorial experiments using bar graphs or line graphs, based on the patterns of the variables.
Based on the team's findings, diagnose which type of interaction effect is present in this study, and explain how this pattern would look visually on a graph.
A researcher is plotting the results of a factorial experiment where the effectiveness of two teaching methods completely reverses depending on whether the students are introverts or extroverts. If the researcher decides to visualize this cross-over interaction using a line graph, describe what the lines will do.
Learn After
When examining a bar graph of an interaction effect, what characterizes a spreading interaction?
A researcher creates a bar graph to display the results of a 2 × 2 factorial experiment. At the first level of the variable on the horizontal axis, the two bars are nearly identical in height. At the second level, one bar is substantially taller than the other. This pattern is best described as a cross-over interaction.
A researcher is analyzing a bar graph for a factorial design. At the first level of the horizontal axis variable, the two comparison bars are of equal height. At the second level, however, the height difference between the bars is large and prominent. By evaluating how the relationship between these bars changes in magnitude across the two levels without a reversal in direction, the researcher identifies the presence of a(n) ________ interaction.
An undergraduate researcher is evaluating various visual data patterns from a $2 \times 2$$ factorial design to determine which outcome most definitively supports a 'spreading interaction' hypothesis compared to a 'cross-over interaction'. Arrange the following bar graph descriptions in order from the most definitive evidence of a spreading interaction to the most definitive evidence of a cross-over interaction.
Based on visual patterns in bar graphs for a factorial design, match each interaction term with its corresponding description.
Match each research finding with the bar-graph interaction pattern it would produce, assuming the first variable mentioned is on the horizontal axis and the second is represented by the bar colors. (Each pattern label may be used more than once.)
A researcher runs a 2×2 factorial experiment and displays the results in a bar graph. Match each description of the bar graph's visual pattern to the correct term.
A psychology researcher conducts a 2×2 factorial study examining the effects of study method (spaced vs. massed practice) and sleep quality (good vs. poor) on exam performance. The bar graph shows that students with good sleep score substantially higher with spaced practice than with massed practice, whereas students with poor sleep score nearly the same regardless of study method. Which type of interaction does this bar graph depict?
A researcher analyzes a bar graph from a 2×2 factorial design and observes that at Level 1 of the horizontal-axis variable, the bar for Condition B1 is substantially taller than the bar for Condition B2, while at Level 2 the bar for Condition B1 is only slightly taller than the bar for Condition B2. Because a height difference between B1 and B2 is visible at both levels, the researcher concludes that the graph displays a cross-over interaction.
A researcher presents the following findings to a peer review panel: 'At Level 1 of Variable A, participants in Condition B1 scored 30 points higher than participants in Condition B2. At Level 2 of Variable A, participants in Condition B2 scored 25 points higher than participants in Condition B1.' A panel member evaluating the strength of this finding concludes that the bar graph for these data would display a _____ interaction—the type considered the most compelling evidence that the effect of
Based on the visual representation of interaction effects in bar graphs, define the terms 'spreading interaction' and 'cross-over interaction' by describing the specific visual patterns of bar heights that characterize each type.
Evaluate the research team's interpretation of their bar graph. Explain why their label is correct or incorrect, and describe the correct interaction pattern shown in their graph based on the relative bar heights across both levels of task complexity.
Suppose a researcher expects a spreading interaction in a factorial experiment where independent variable A (levels A1 and A2) is on the horizontal axis and variable B (levels B1 and B2) is represented by bar colors. If there is a large difference in scores between B1 and B2 at level A1, describe what the comparison bars (B1 vs. B2) must look like at level A2 to support their hypothesis.