Learn Before
Histogram of Self-Esteem Scores
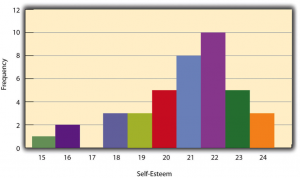
A histogram can be used to display the distribution of self-esteem scores, providing a visual representation of a frequency table. In this histogram, the -axis represents the self-esteem variable and the -axis represents the frequency. Because self-esteem scores represent a quantitative variable, there are generally no gaps between the vertical bars. However, if a specific score has a frequency of zero—such as having no individuals with a score of in the data set—a noticeable gap will appear at that specific level on the histogram.
0
1
Tags
KPU
Research Methods in Psychology - 4th American Edition @ KPU
Related
Histogram Bar Gaps
Histogram of Self-Esteem Scores
Which graphical tool is used during preliminary analyses to plot the frequency of different scores and evaluate the distribution and shape of a single variable?
Match each component or characteristic of a histogram with the specific insight it provides a researcher when evaluating a single variable's distribution.
A researcher creates the histogram below to evaluate the distribution of 'Self-Esteem' scores in a sample of college students. True or False: Based on the visual evidence in this graph, the researcher should conclude that the distribution is positively skewed, meaning the majority of participants scored at the lower end with a tail extending toward the higher scores.
A psychology researcher is analyzing the frequency distribution of scores in the provided histogram to determine the appropriate descriptive statistics for their report. Arrange the following steps in the correct logical sequence to analyze how the visual characteristics of this graph determine the mathematical relationship between the mean and the median.
True or False: A histogram is a graphical tool used during preliminary analyses to evaluate the distribution and shape of multiple variables simultaneously.
Shape of a Distribution
In psychological research, why is it valuable to construct a histogram during the early stages of data analysis rather than relying solely on summary statistics like the mean or standard deviation?
A researcher is evaluating a frequency plot of scores and observes that the distribution's tail extends significantly toward one side. By identifying this shape in the _____ as a skew, the researcher makes the evaluative judgment that the mean may not accurately represent the typical participant's experience, which justifies a more cautious interpretation of the descriptive statistics.
A psychology lab is conducting preliminary analyses on participant datasets. Match each researcher's specific visualization activity to the core histogram concept they are applying.
A researcher computed the mean and standard deviation of their sample's self-esteem scores. To analyze whether these calculated descriptive statistics are representative or misleading due to a skewed distribution, they must inspect the shape of this single variable by constructing a _____ during their preliminary analyses.
Arrange the steps in the correct logical sequence for a researcher evaluating a dataset's characteristics and justifying their descriptive statistics using a histogram.
Recall the definition and primary function of a histogram as a graphical tool in psychological research. Specifically, describe what it plots, what it is used to evaluate during preliminary analyses, and how it helps researchers interpret their descriptive statistics.
Based on the provided case, explain how constructing a histogram helps the psychologist comprehend their self-esteem dataset. How does this visual evaluation assist them in interpreting what their calculated descriptive statistics represent?
A cognitive researcher has computed a mean reaction time of 350 milliseconds for a sample, but wants to make sure this statistic is not misleading. How should the researcher apply a histogram during their preliminary analyses to verify whether this mean is representative of the sample's actual distribution?
Learn After
In a histogram displaying self-esteem scores, a gap between two bars indicates that no individuals in the data set received the score represented by that gap.
In a histogram representing a distribution of self-esteem scores, such as the one shown in the image, what is the primary significance of the vertical bars being placed immediately adjacent to each other without gaps?
A psychology researcher conducts a study on self-esteem and creates the graph shown in the image to summarize the results. To correctly interpret this data, match each visual characteristic of the graph with the specific piece of information it conveys about the study's participants.
A researcher is analyzing the distribution of data in the provided graph of self-esteem scores. Arrange the following steps in the logical order required to explain the visual structure of the gap seen at score 17.
In a histogram displaying a distribution of self-esteem scores, what is represented on the vertical (-axis)?
Because self-esteem represents a quantitative variable, a histogram displaying self-esteem scores is required to have adjacent vertical bars with no gaps, even if a specific score—such as —has a frequency of .
If a researcher justifies the removal of the gap at score in a histogram of self-esteem scores by claiming that quantitative data must always be displayed with adjacent bars, their justification is _____ because it fails to account for the necessary representation of values with a frequency of zero.
A psychology researcher is constructing a histogram to present self-esteem scores from a new survey. Match each component of the researcher's dataset and study design to its correct visual representation on the histogram.
An investigator analyzes a histogram representing a quantitative self-esteem variable and notices that all vertical bars are adjacent except for a single gap at the score of . By analyzing this visual pattern, the investigator can deduce that the frequency of the score of in the raw dataset is exactly _____.
A researcher needs to evaluate whether a gap at the score of in their self-esteem histogram is a methodologically valid representation of their dataset rather than a software error. Order the steps they should take to make this evaluation.
In a histogram displaying the distribution of self-esteem scores, what do the -axis and -axis represent, and under what condition does a gap appear between the vertical bars?
Explain why the vertical bars in this histogram are generally adjacent without gaps, and explain the significance of the gap at the score of .
A researcher is constructing a histogram to present a distribution of self-esteem scores. The dataset contains scores from to , but no participants received a score of . How should the researcher format the vertical bars overall and at the specific score of on the histogram?