Using Isocost Lines to Compare Production Technologies
Isocost lines are a key tool for firms to evaluate and compare different production technologies, particularly those that are not dominated by others in terms of input usage. By representing various cost levels, these lines help identify the most cost-effective method for producing a specific amount of output at given input prices. A firm can determine which technology minimizes costs by identifying which available option lies on the lowest possible isocost line.
0
1


Tags
Social Science
Empirical Science
Science
Economy
CORE Econ
The Economy 1.0 @ CORE Econ
Ch.1 The Capitalist Revolution - The Economy 1.0 @ CORE Econ
Ch.2 Technology, Population, and Growth - The Economy 1.0 @ CORE Econ
Economics
Introduction to Microeconomics Course
Ch.2 Technology and incentives - The Economy 2.0 Microeconomics @ CORE Econ
The Economy 2.0 Microeconomics @ CORE Econ
Related
Drawing an Isocost Line Using Endpoints
Points Above an Isocost Line Represent Higher Costs
Technology Choice and Isocost Slope Depend on Relative Input Prices
A firm's isocost line represents all combinations of inputs that can be purchased for a given total cost. If the price of labor is $20 per hour and the price of capital is $40 per unit, which of the following combinations of labor and capital lies on the isocost line for a total cost of $400?
A firm is evaluating two production techniques. Technique X uses 10 hours of labor and 4 tons of coal. Technique Y uses 12 hours of labor and 3 tons of coal. It is possible for both Technique X and Technique Y to be on the same isocost line.
Production Cost Decision
Analyzing Input Trade-offs
A manufacturing firm operates on an isocost line representing a total expenditure of $1,000. The firm uses two inputs: labor, at a price of $20 per hour, and raw materials, at a price of $50 per unit. If the firm decides to use one additional unit of raw materials, how must it adjust its use of labor to ensure the new combination of inputs remains on the same isocost line?
A firm uses two inputs, labor and capital. A specific production method, Method X, uses a combination of these inputs that costs a total of $1,200. On a graph with labor on one axis and capital on the other, an isocost line is drawn through the point representing Method X. Another production method, Method Y, is represented by a point that lies below this isocost line. What can be concluded about the total cost of using Method Y?
A textile factory uses two inputs: labor, priced at $25 per hour, and fabric, priced at $10 per yard. To produce a batch of shirts, the factory uses 8 hours of labor and 30 yards of fabric. The total expenditure for this combination of inputs, which represents one point on the factory's isocost line, is $____.
Evaluating Production Options
A firm uses two inputs: labor and capital. Two different production methods, Method P and Method Q, are known to lie on the same isocost line. Method P uses 10 units of labor and 5 units of capital. Method Q uses 8 units of labor and 6 units of capital. Based on this information, what can be concluded about the relative prices of labor and capital?
Interpreting the Isocost Line
Using Isocost Lines to Compare Production Technologies
Using Isocost Lines to Compare Production Technologies
Consider two situations: (A) A person waits their turn in a line to buy a movie ticket. (B) A driver stops their car at a red traffic light. Which statement best analyzes the difference between the guiding principles of these two actions?
A bakery has an isocost line representing all combinations of flour and labor that cost exactly $200 to purchase. The bakery is evaluating four new recipe plans, each requiring a different combination of these two inputs. If these plans were plotted on a graph with the $200 isocost line, which plan would be unaffordable without increasing the budget beyond $200?
Production Technique Affordability Analysis
A manufacturing firm has a budget of $5,000 for labor and raw materials, represented by a specific isocost line on a graph. The firm is considering a new production method that, when plotted, corresponds to a point located above this isocost line. Based on this information, the new production method can be adopted without exceeding the firm's current $5,000 budget.
Interpreting Isocost Line Positions
A firm's budget for two production inputs is visualized as a single isocost line on a graph. The firm considers three potential input combinations, represented by points on the same graph: Point A is above the line, Point B is on the line, and Point C is below the line. Match each point to its corresponding cost relationship with the firm's budget.
Rationale for Isocost Line Interpretation
A manager at a textile factory is presented with a graph showing the company's current budget for labor and cotton, represented by a single line for a total cost of $10,000. A consultant proposes a new production technique. When the input requirements for this new technique are plotted on the same graph, the point falls significantly above the $10,000 line. The consultant claims, 'This new technique is a viable option for immediate implementation under your current budget.' Which of the following provides the most accurate evaluation of the consultant's claim?
A firm uses two inputs, Labor and Capital, with prices of $20 per hour for Labor and $100 per unit for Capital. The firm's current budget is represented by an isocost line for a total cost of $2,000. The firm is considering a new production technique that requires 60 hours of Labor and 10 units of Capital. How does this new technique relate to the firm's current budget?
Farm Budget Analysis
A manufacturing firm has a budget of $5,000 for labor and raw materials, represented by a specific isocost line on a graph. The firm is considering a new production method that, when plotted, corresponds to a point located above this isocost line. Based on this information, the new production method can be adopted without exceeding the firm's current $5,000 budget.
The £40 Isocost Line (FG)
Using Isocost Lines to Compare Production Technologies
Cost-Effective Production Choice
A firm needs to produce 100 metres of cloth and has five production methods available, each using a different combination of labor (workers) and energy (tonnes of coal). The input requirements for each method are shown in the table below.
Method Workers Tonnes of Coal A 1 10 B 2 5 C 4 6 D 5 3 E 10 1 A production method is considered inefficient if another available method can produce the same output using less of at least one input without using more of the other. Based on this principle, which method is clearly inefficient?
A firm can produce 100 metres of cloth using five different methods, each with a unique combination of labor and energy inputs as shown in the table. Match each description of a production strategy to the corresponding method.
Method Workers Tonnes of Coal A 1 10 B 2 5 C 4 6 D 5 3 E 10 1 A firm can produce 100 metres of cloth using five different methods, each with a unique combination of labor and energy inputs as shown in the table. Match each description of a production strategy to the corresponding method.
Method Workers Tonnes of Coal A 1 10 B 2 5 C 4 6 D 5 3 E 10 1 Evaluating Production Efficiency
A textile firm can produce 100 metres of cloth using any of the five methods shown in the table below, which specify the number of workers and tonnes of coal required.
Method Workers Tonnes of Coal A 1 10 B 2 5 C 4 6 D 5 3 E 10 1 Statement: A profit-maximizing firm would never choose Method D, regardless of the price of labor and the price of coal.
Optimal Production Technology Selection Process
A firm can produce 100 metres of cloth using any of the five methods shown in the table, which specifies the number of workers and tonnes of coal required.
Method Workers Tonnes of Coal A 1 10 B 2 7 C 4 4 D 7 2 E 10 1 Initially, the wage for a worker is £10 and the price of coal is £20 per tonne. Later, the wage increases to £40 per worker and the price of coal falls to £5 per tonne. How does the firm's most cost-effective choice of production method change in response to these new input prices?
A firm can produce a specific quantity of cloth using five different production methods. Each method uses a combination of two inputs: labor (number of workers) and energy (tonnes of coal). The input combinations for the methods are: Method A (2 workers, 8 tonnes), Method B (3 workers, 5 tonnes), Method C (5 workers, 6 tonnes), Method D (6 workers, 3 tonnes), and Method E (8 workers, 2 tonnes). A method is considered inefficient if another available method can produce the same output using less of at least one input without using more of the other. Based on this principle, which method would a cost-minimizing firm never select, regardless of the price of labor and energy?
Proposing a New Production Technology
Learn After
Example of a £40 Isocost Line (w=£5, p=£10)
Graphical Method for Comparing Technology Costs
Diagram Setup for Technology Cost Comparison
The full employment observed in the Soviet Union during the 1930s was a direct result of its state-controlled industries being more efficient and productive than their counterparts in Western capitalist nations.
A textile company needs to produce 100 meters of cloth and is considering four different production technologies, each using a different combination of labor and coal. The wage for a worker is £10 per hour, and the price of coal is £20 per ton. Given the input requirements below, which technology should the company choose to minimize its production costs?
Cost-Minimizing Technology Selection
A firm is producing 100 units of output and is evaluating four different production technologies, represented by points A, B, C, and D on a graph with labor on the x-axis and capital on the y-axis. The firm's costs are represented by a series of parallel isocost lines, where lines closer to the origin represent lower total costs. The positions are as follows:
- Technology A is on an isocost line representing a total cost of $200.
- Technology B is on an isocost line representing a total cost of $150.
- Technology C is on an isocost line representing a total cost of $250.
- Technology D is located between the $150 and $200 isocost lines.
Based on this information, which technology is the most cost-effective for producing the 100 units?
A company manufactures widgets using a combination of two inputs: human labor and automated machinery. Initially, wages for labor are low, and the cost of machinery is high, so the company uses a production method that relies heavily on workers. If the wages for labor increase significantly while the cost of machinery stays the same, how would the company most likely adjust its production method to continue producing the same number of widgets at the lowest possible cost?
A firm produces a specific quantity of output using two inputs: labor (plotted on the horizontal axis) and capital (plotted on the vertical axis). A diagram displays three possible production technologies (A, B, and C). A solid isocost line, representing a total cost of $1,000 at current input prices, passes directly through the point for Technology B. Technology A is located above this line, and Technology C is located below it. To minimize its production costs, which technology should the firm choose?
A company produces goods using labor and machinery. The wage for labor is $20 per hour and the rental cost of machinery is $40 per hour. The company is currently using a production method that lies on the isocost line representing a total cost of $400. If a new, more cost-effective production method is discovered, it must be represented by a point that lies below this $400 isocost line.
Impact of Changing Input Prices on Technology Choice
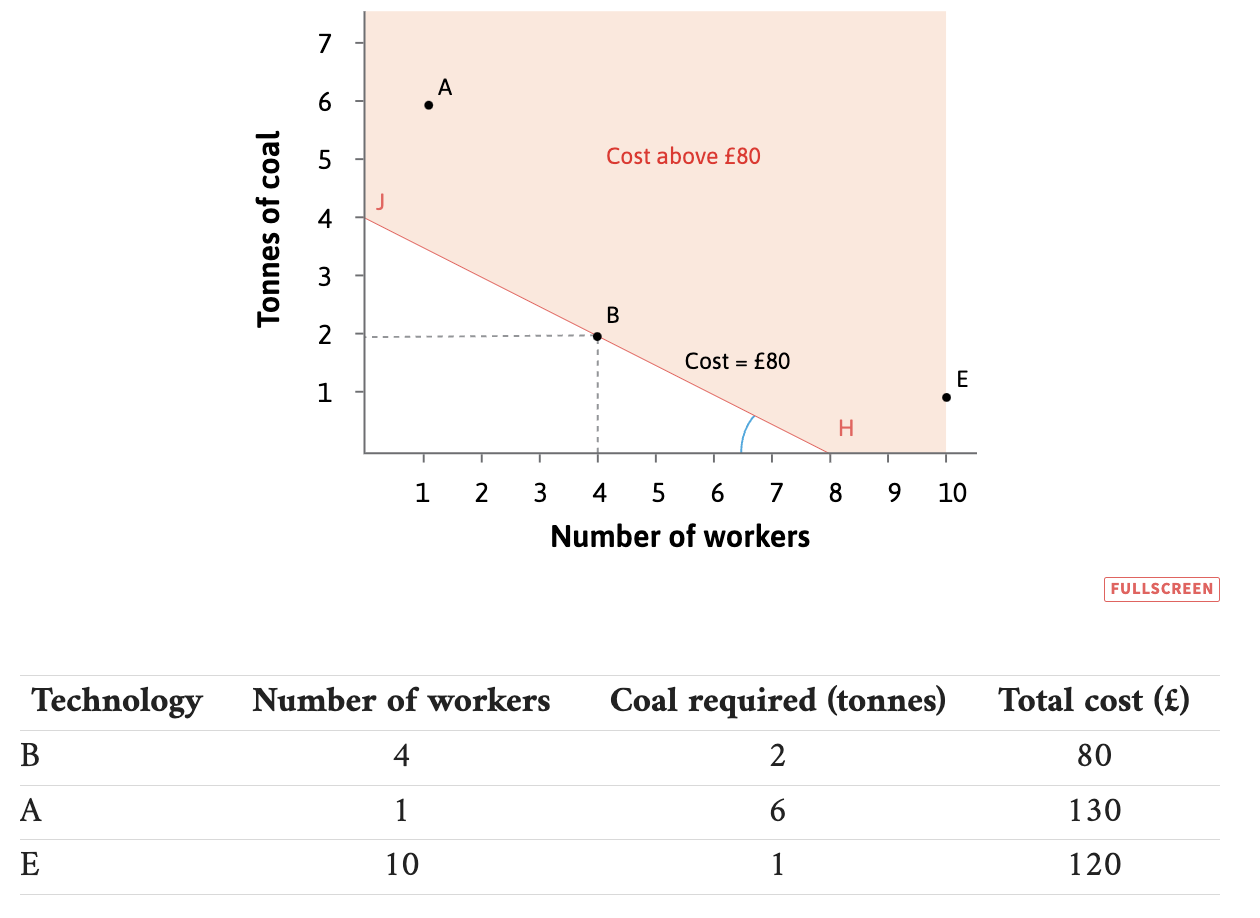
Technology B as the Least-Cost Technology at w=£10, p=£20
Evaluating a Production Strategy
A firm produces a product using two inputs: labor (plotted on the horizontal axis) and capital (plotted on the vertical axis). The firm has several production technologies available and has chosen the one that minimizes its total cost, represented by the point where the lowest possible isocost line touches one of the technology points. If the price of capital rises significantly while the wage for labor stays the same, how will the isocost line and the optimal choice of technology be affected?
A firm is producing 100 units of output and is evaluating four different production technologies, represented by points A, B, C, and D on a graph with labor on the x-axis and capital on the y-axis. The firm's costs are represented by a series of parallel isocost lines, where lines closer to the origin represent lower total costs. The positions are as follows:
- Technology A is on an isocost line representing a total cost of $200.
- Technology B is on an isocost line representing a total cost of $150.
- Technology C is on an isocost line representing a total cost of $250.
- Technology D is located between the $150 and $200 isocost lines.
Based on this information, which technology is the most cost-effective for producing the 100 units?