Learn Before
APA Style Bar Graphs
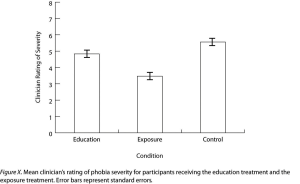
Bar graphs are commonly used in research to present and compare the mean scores for two or more groups or conditions. Following conventions, researchers typically use a bar graph when the independent variable plotted on the -axis is categorical.
0
1
Tags
KPU
Research Methods in Psychology - 4th American Edition @ KPU
Related
APA Style Bar Graphs
APA Style Line Graphs
When formatting a scatterplot, bar graph, or line graph in APA style, which of the following layout guidelines is correct?
Match each APA style graph element with its corresponding layout guideline.
A researcher is constructing a line graph to illustrate the results of a study on 'caffeine intake' (the independent variable) and 'heart rate' (the dependent variable). To follow APA style, they design the graph to be slightly wider than it is tall, with 'caffeine intake' on the horizontal x-axis and 'heart rate' on the vertical y-axis. To better visualize the changes in heart rate, the researcher starts the vertical y-axis at a value of 40 instead of zero. This layout correctly adheres to APA
A researcher is evaluating four different drafts of a line graph for a study on social anxiety. Based on the technical guidelines in the APA Publication Manual for graph layouts, arrange these drafts in order from the one that contains the most technical violations to the one that is fully compliant.
You are tasked with generating a technical blueprint for a bar graph that will represent the effect of 'Type of Therapy' (the independent variable) on 'Anxiety Reduction Score' (the dependent variable). To ensure the graph fully complies with the layout guidelines established in the APA Publication Manual, which construction plan should you follow?
According to the APA Publication Manual, graphs such as scatterplots, bar graphs, and line graphs should generally be constructed to be slightly taller than they are wide.
A researcher is reviewing a draft of a scatterplot where 'Exercise Frequency' (the independent variable) is currently plotted on the vertical axis. To bring this layout into compliance with APA style guidelines, the researcher must move 'Exercise Frequency' to the _____ axis.
A researcher is graphing the results of an experiment studying the effect of 'caffeine dosage' (independent variable) on 'reaction time' (dependent variable). Match each graph component with its correct APA-style layout configuration.
A researcher is auditing a draft of a line graph displaying 'Weekly Therapy Sessions' (independent variable) and 'Depression Score' (dependent variable). On the horizontal axis, the therapy session values decrease from left to right. To correct this layout error and comply with APA guidelines, the researcher must reformat the axis so that the numerical values increase from left to _____.
Evaluate the following three draft layouts for a bar graph representing the effect of 'Study Time' (independent variable) on 'Test Score' (dependent variable). Order the drafts from most compliant with APA style guidelines (1st) to least compliant (3rd).
According to the APA Publication Manual, what are the technical layout guidelines regarding graph dimensions, variable placement on axes, direction of numerical increases, and starting values for the axes in scatterplots, bar graphs, and line graphs?
Based on the layout guidelines in the APA Publication Manual, diagnose the errors in the student's graph design and explain how each aspect should be corrected to comply with APA style.
Apply the APA Publication Manual guidelines to describe the exact layout configuration of a scatterplot showing the relationship between age (independent variable) and reaction time (dependent variable), specifying its relative dimensions, axis assignments, value directions, and starting values.
Learn After
Error Bars
Example of a Bar Graph: Clinician Rating of Severity
Example of an APA-Style Bar Graph
According to standard research conventions, what type of independent variable is typically plotted on the x-axis when using a bar graph to present and compare mean scores?
A researcher wants to visually compare the mean anxiety scores among three distinct treatment groups. According to standard research conventions, a bar graph would be an appropriate way to present this data.
A researcher is creating an APA style bar graph to display the results of a study comparing the average job satisfaction levels (on a scale of 1 to 50) across three different career fields: Healthcare, Education, and Technology. Match each element of this research scenario to its correct representation on the graph.
A researcher is preparing to present findings from a study comparing the average reaction times of three different age groups (Young, Middle-aged, and Senior). Arrange the logical steps the researcher must follow to correctly represent these results using an APA-style bar graph.
Synthesize a research protocol for a new study on social influence. Arrange the following steps in the logical order required to design a research study that specifically necessitates an APA-style bar graph to communicate the results.
A researcher is planning how to visually represent the findings of their study in a research report. Under what conditions is a bar graph the most appropriate choice to present the data, according to standard APA style conventions?
A researcher is evaluating two different graph drafts to present the mean scores of three distinct experimental conditions on the -axis. To correctly apply APA conventions for categorical independent variables, the researcher should conclude that the _____ graph is the superior choice for this comparison.
According to standard research conventions in psychology, a bar graph is typically used to present and compare mean scores when the independent variable plotted on the -axis is _____.
A researcher studying memory compares mean recall scores across five specific time delays — 10 minutes, 1 hour, 24 hours, 1 week, and 1 month after learning — and displays the results using a bar graph with time delay on the -axis. According to APA conventions, this is an appropriate graph choice because bar graphs are designed to present and compare mean scores across two or more groups or conditions.
A research methods instructor reviews four student graph design decisions. For each decision, match it to the correct evaluative verdict based on APA bar graph conventions.
Describe the primary purpose of a bar graph in psychology research and state the convention regarding what type of independent variable is plotted on the -axis.
Explain why a bar graph is the appropriate choice for the psychologist to display these findings, making reference to both the groups being compared and the axis conventions.
An experimenter is comparing the average reaction times of participants who consumed either caffeinated coffee, decaffeinated coffee, or water. Apply graphing conventions to determine what type of graph should be used to display the results and identify the variable that should be plotted on the -axis.