Learn Before
Example of an APA-Style Bar Graph
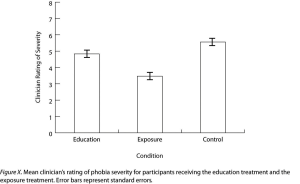
An APA-style bar graph can effectively present the results of an experiment by comparing mean scores across categorical conditions, such as in the research by Ollendick and colleagues. In such graphs, error bars are typically added to the top of each main bar, extending one standard error upward and downward. This visual addition allows readers to observe the variability within each group and visually estimate whether the differences between the group means are statistically significant.
0
1
Tags
KPU
Research Methods in Psychology - 4th American Edition @ KPU
Related
Error Bars
Example of a Bar Graph: Clinician Rating of Severity
Example of an APA-Style Bar Graph
According to standard research conventions, what type of independent variable is typically plotted on the x-axis when using a bar graph to present and compare mean scores?
A researcher wants to visually compare the mean anxiety scores among three distinct treatment groups. According to standard research conventions, a bar graph would be an appropriate way to present this data.
A researcher is creating an APA style bar graph to display the results of a study comparing the average job satisfaction levels (on a scale of 1 to 50) across three different career fields: Healthcare, Education, and Technology. Match each element of this research scenario to its correct representation on the graph.
A researcher is preparing to present findings from a study comparing the average reaction times of three different age groups (Young, Middle-aged, and Senior). Arrange the logical steps the researcher must follow to correctly represent these results using an APA-style bar graph.
Synthesize a research protocol for a new study on social influence. Arrange the following steps in the logical order required to design a research study that specifically necessitates an APA-style bar graph to communicate the results.
A researcher is planning how to visually represent the findings of their study in a research report. Under what conditions is a bar graph the most appropriate choice to present the data, according to standard APA style conventions?
A researcher is evaluating two different graph drafts to present the mean scores of three distinct experimental conditions on the -axis. To correctly apply APA conventions for categorical independent variables, the researcher should conclude that the _____ graph is the superior choice for this comparison.
According to standard research conventions in psychology, a bar graph is typically used to present and compare mean scores when the independent variable plotted on the -axis is _____.
A researcher studying memory compares mean recall scores across five specific time delays — 10 minutes, 1 hour, 24 hours, 1 week, and 1 month after learning — and displays the results using a bar graph with time delay on the -axis. According to APA conventions, this is an appropriate graph choice because bar graphs are designed to present and compare mean scores across two or more groups or conditions.
A research methods instructor reviews four student graph design decisions. For each decision, match it to the correct evaluative verdict based on APA bar graph conventions.
Describe the primary purpose of a bar graph in psychology research and state the convention regarding what type of independent variable is plotted on the -axis.
Explain why a bar graph is the appropriate choice for the psychologist to display these findings, making reference to both the groups being compared and the axis conventions.
An experimenter is comparing the average reaction times of participants who consumed either caffeinated coffee, decaffeinated coffee, or water. Apply graphing conventions to determine what type of graph should be used to display the results and identify the variable that should be plotted on the -axis.
Learn After
In an APA-style bar graph, error bars are typically added to the top of each main bar, extending one ________ upward and downward to help readers observe the variability within each group.
In the provided APA-style bar graph, what is the primary purpose of the vertical error bars extending from the top of each main bar?
Based on the provided APA-style bar graph (Figure 12.11), the error bars for the 'ACT' and 'CBT' groups do not overlap. According to the principles of interpreting such graphs, this visual separation allows a researcher to estimate that the difference between these two group means is likely statistically significant.
Analyze the provided APA-style bar graph. Match each visual component of the graph with the specific analytical insight it provides to a researcher evaluating the experimental results.
Based on the provided APA-style bar graph in Figure 12.11, evaluate the visual evidence for statistical significance between the different conditions. Arrange the following group comparisons in order from the strongest evidence of a statistically significant difference to the weakest evidence, based on the magnitude of mean differences and the separation of the vertical error bars.
Imagine you are designing an original APA-style bar graph to present the findings of a new study comparing three different therapeutic techniques for anxiety. To ensure your visualization allows a reader to effectively compare the mean outcomes while visually estimating the likelihood of statistical significance, which structural design should you implement?
In an APA-style bar graph, the height of each main bar represents the mean score of a categorical condition.
A student is reading an APA-style bar graph comparing mean fear-reduction scores across four treatment conditions (CBT, Education, Wait-list, and ACT), similar to the graph from Ollendick and colleagues. Match each specific reading goal to the correct action to take when examining this graph.
An APA-style bar graph shows that the 'CBT' condition bar is noticeably taller than the 'Education' condition bar, yet the error bars of both conditions overlap substantially. A researcher analyzing this graph should conclude that the visual evidence _____ the conclusion that CBT significantly outperforms Education, because the overlapping error bars indicate that within-group variability is large relative to the observed difference in group means.
A peer reviewer is evaluating whether an APA-style bar graph has been correctly constructed and whether the authors' interpretation of it is justified. Arrange the following reviewer steps in the order that best reflects a rigorous and logical evaluation.
Explain the construction and components of an APA-style bar graph used to present experimental results, specifically describing the purpose and extension of error bars.
Explain why the current draft of the bar graph is considered incomplete under APA guidelines, and describe what visual element must be added, including how it should be constructed and how it helps the reader interpret the results.
You are designing an APA-style bar graph to compare mean scores across categorical conditions. If the standard error for Group A is 2.5 and for Group B is 4.0, how should you construct the error bars for these groups, and what will they allow a reader to do when viewing your graph?